QI Run Chart Builder · Free
The run chart rules,
checked for you.
Paste your quality improvement measure. Get a clean run chart with the median, goal and change notes, and see every shift, trend and runs signal flagged and explained. No account, no upload: it runs in your browser.
For residents, nurses, and quality teams working with aggregate data. Not for patient-level information.
Counting points by hand is where QI projects go wrong
A run chart is usually the first picture of a quality improvement project: your measure over time, with the median drawn across it. It is simple to draw in a spreadsheet. Reading it correctly is the hard part. You have to find the median, skip the points that sit on it, count consecutive points on one side, ignore repeated values when looking for a trend, count the runs, and then look up the runs limits in a table.
Do that by hand at 11 p.m. before a QI meeting and it is easy to call a signal that is not there, or miss one that is. The QI Run Chart Builder does the counting the same way every time and tells you, in plain language, which rule fired, where, and whether it moved in the direction you wanted.
How it works
1. Add your measure
Name it, choose whether higher or lower is better, and add an optional goal. Type points one at a time or paste two columns straight from a spreadsheet.
2. See the chart
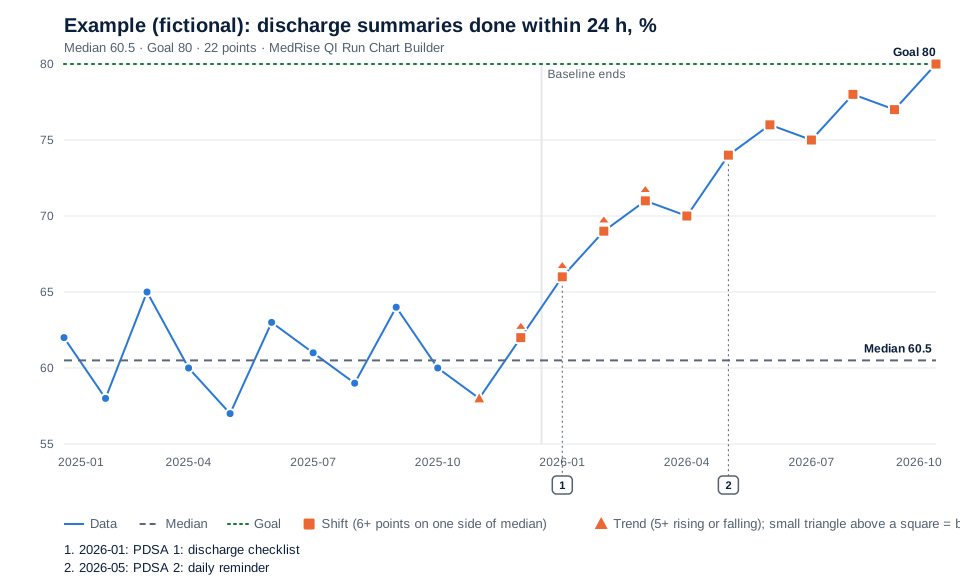
The median is drawn as a dashed line and the goal as a dotted one. Shift points become squares and trend points triangles, so signals never depend on color alone.
3. Read the verdict
Each rule gets a clear result: signal, no signal, or needs more data. Export the chart as PNG or SVG for your slides and the data as CSV.
The four run chart rules, in plain words
The tool follows the rules described by Perla, Provost and Murray in BMJ Quality & Safety (2011), which are widely taught in healthcare improvement, including by the Institute for Healthcare Improvement.
- Shift: six or more consecutive points all above or all below the median. Points exactly on the median are skipped; they neither add to nor break the shift.
- Trend: five or more consecutive points all going up or all going down. When values repeat, only one of them is counted.
- Runs: a run is a series of points on one side of the median. Too few or too many runs, compared with the published table for 10 to 60 points not on the median, suggests a non-random pattern.
- Astronomical point: a value obviously different from all the others. This one needs human judgment, so the tool reminds you to look rather than guessing for you.
The shift and runs rules need more than 10 data points before they apply. Until then the tool says so instead of showing a misleading result.
Who it is for
- Residents and fellows doing a QI project. The ACGME Common Program Requirements (Residency) expect residents to analyze practice using quality improvement methods and to take part in interprofessional patient safety and quality improvement activities.
- Nurses, nurse leaders and infection preventionists tracking compliance, audit results, or turnaround times week by week.
- Students and faculty learning or teaching how to read a run chart, using the fictional example data.
- Quality and GME teams who want every project charted and interpreted the same way.
How to make a run chart in two minutes
- Open the tool and name your measure, for example "Hand hygiene audits compliant, %".
- Choose Higher or Lower under "Better when the value is" so signals are labeled as wanted or unwanted.
- Copy the period and value columns from your spreadsheet and paste them into "Paste many rows at once".
- If you have a stable baseline period, enter how many points it covers. The median is then frozen on the baseline and extended forward, which is how you see whether your changes moved the process.
- Add a change note on the point where each test of change (PDSA cycle) began. Notes appear as numbered tags on the chart.
- Read the results panel, then download the PNG for your slides and the CSV for your records.
Pricing
The free tool is complete and live now.
Free
- Up to 50 measures of 300 points each, saved in your browser
- Shift, trend and runs rules checked automatically
- Baseline median, goal line, change notes
- PNG, SVG and CSV export; JSON backup
Pro
or $39 per year
- Account with your charts synced across devices
- Multiple phases (re-baseline after each change)
- Control charts (XmR and p-charts)
- One-page PDF project summary for presentations
Team
for a residency program, unit, or quality department; annual invoicing available
- Everything in Pro for up to 40 people
- Program dashboard of every QI project
- Shared measure templates and definitions
- Coordinator export for annual program review
Pro and Team are in early access. Reserving a spot is free and nobody is charged until their plan is activated; we will email you from admin@med-rise.com with the final price before anything is billed.
FAQ
What are the run chart rules?
The four commonly used rules are: a shift (six or more consecutive points all above or all below the median), a trend (five or more consecutive points all going up or all going down), too few or too many runs for the number of points not on the median, and an astronomical point that is obviously different from the rest. They are described by Perla, Provost and Murray in BMJ Quality & Safety (2011).
How many data points do I need?
The shift and runs rules need more than 10 data points before they apply. The tool tells you when a rule cannot be checked yet.
What happens to points exactly on the median?
They neither add to nor break a shift, and they are left out of the count of useful observations used for the runs rule. Repeated equal values are counted once when looking for a trend.
Can I enter patient data?
No. Enter aggregate measures only, such as a weekly percentage or a monthly count. Never enter names, record numbers, dates of birth or other identifiers. Your data stays in your browser.
Is this a control chart?
No. A run chart uses the median and probability-based rules. Statistical process control charts with control limits are planned for the Pro plan.
Does a signal prove my intervention worked?
No. A signal says the pattern is unlikely to be random variation. Whether your change caused it is a question for your team, your annotations, and your organization's quality reviewers.
Chart your measure now
Free, private, and ready in your browser. Try the fictional example first if you want to see a shift and a trend in action.
Education and workflow support only. The QI Run Chart Builder charts aggregate measures for quality improvement learning. It does not diagnose, treat, or make recommendations about any patient and does not replace your organization's quality or statistical review. See the terms and disclaimer and privacy notice.